Uplift Model in Causal Inference
Info
Author: Echo, published on 2022-02-03, reading time: about 6 minutes, WeChat public account article link:
1 Background
During the Chinese New Year stay-at-home period, when chatting with my friends online, I found that we were all bombarded with the same game advertisement (since there are many ways to have fun, but the way to obtain joy beans is really single). My friend became the game's user after passively watching many 30-second ads. And I was moved by its marketing cost and decided to investigate the marketing strategy behind it.

Before we begin, let's review the four quadrants of users.
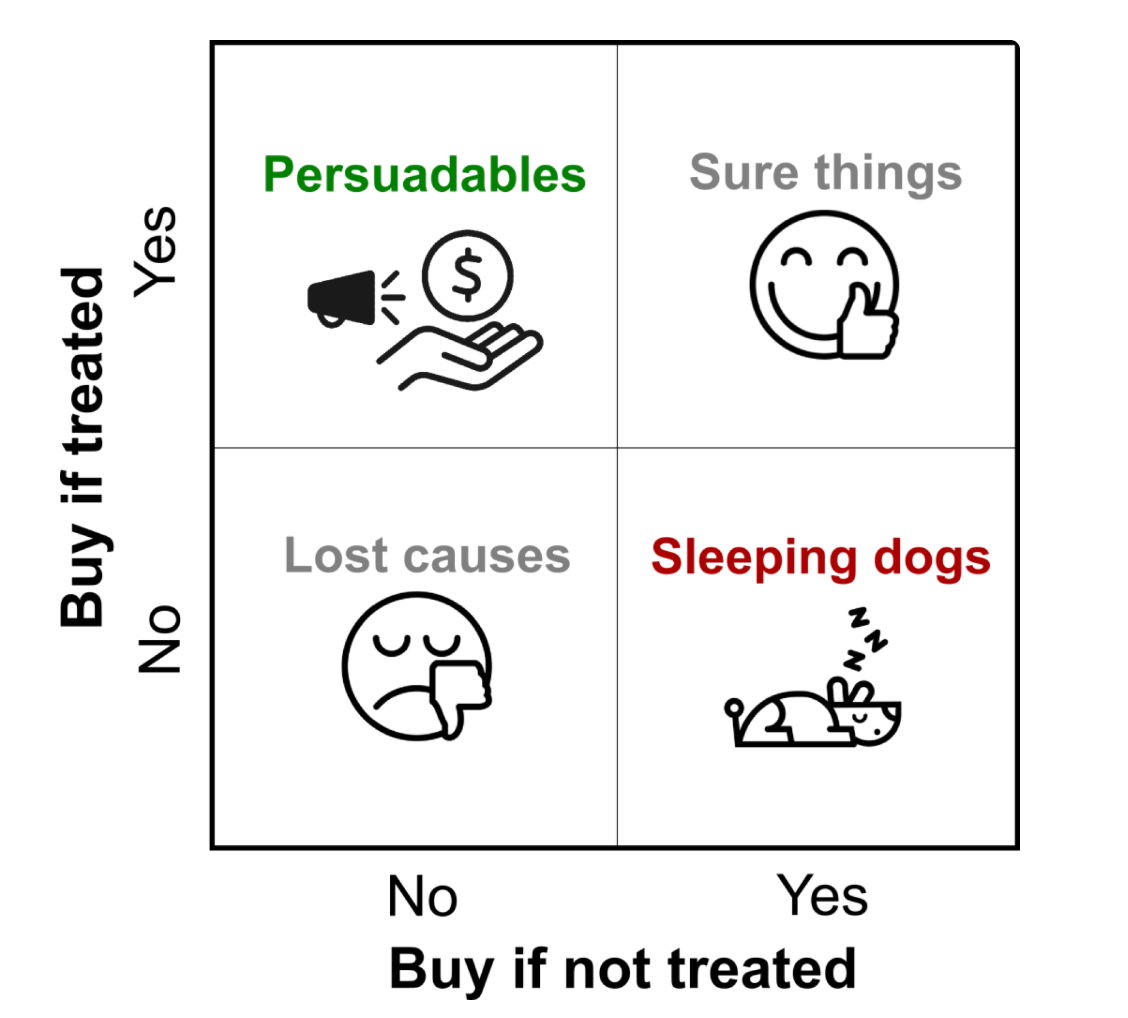
The horizontal and vertical coordinates represent the user's purchase behavior with or without intervention, with intervention as an example of offering coupons: - Persuadables: Intervention-sensitive users who only buy when given a coupon and won't buy if they don't get one. - Sure things: Naturally converted users who will purchase regardless of whether they are offered a coupon. - Lost causes: Granite-hearted users who won't buy whether or not you offer a coupon. - Sleeping dogs: South-north style users who would buy without a coupon, and offering a coupon would instead deter them.
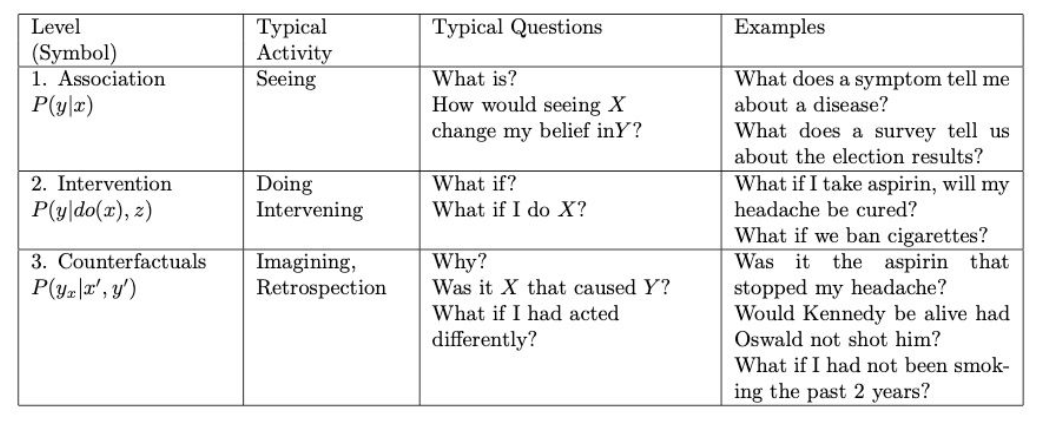
The purpose of offering coupons in the production environment is to increase the final conversion rate. The commonly used response model generally models whether or not to buy a product as the dependent variable to predict the probability of a user buying after giving them a coupon. However, this model focuses on correlation, only looking at whether the independent variable is correlated with the dependent variable, and cannot distinguish whether a user's purchase behavior is caused by the distribution of coupons. Therefore, it cannot identify the natural conversion crowd either and is unable to identify the utility of the coupons. Given that marketing incurs a cost, intervening in the intervention-sensitive user can reflect the role of the marketing activity, so a more effective estimate is to model the causal effect (increment) of an individual's behavior (e.g., purchase) regarding a certain treatment (intervention) with an increase model (Uplift Model). According to the three levels of causal relationships pointed out by Turing Award winner Judea Pearl, it is known that this is a counterfactual causal inference problem. Interested friends can refer to "The Book of Why: The New Science of Cause and Effect" for more detailed explanation.
2 Theoretical Basis
Let X be the user characteristics (e.g., gender, age, income), T be the treatment (with or without intervention, 1 for with, 0 for without), and Y be the dependent variable's result (e.g., click-through rate/conversion rate). Uplift Model aims to predict ITE (Individual Treatment Effect), which can be expressed as the difference in the conversion probability of a user when the intervention is given or not given, namely the difference between the treated and control groups' potential outcomes of independent samples. The objective of the Uplift Model is to maximize \(\tau_{i}\). Considering that it is impossible to know the results of receiving and not receiving coupons for the same user at the same time (the counterfactual element), the model is thus heavily dependent on the assumption of conditional independence CIA(Conditional Independent Assumption), which requires that user characteristics and intervention policies are mutually independent.
In actual applications, a random experiment can obtain samples of the experimental and control groups using intervention strategies, and the feature distributions of the two sample groups are consistent. Only under the CIA hypothesis, the expected value estimate of the causal effect of all samples can represent the overall users without bias. The conditional average intervention effect CATE(Conditional Average Treatment Effect) can be obtained, which is expressed as:
where \(Y_{i}^{o b s}=T_{i} Y_{i}(1)+\left(1-T_{i}\right) Y_{i}(0)\).
3 Model
3.1 Modified Tree Model
The traditional tree model's split rule is information gain. The objective is to maximize the difference in information before and after the split. The aim is to hope that the downstream nodes after feature splitting can distinguish people with higher and lower uplift. In other words, it is hoped that the positive and negative sample distributions between the experimental group and the control group inside the downstream nodes after splitting are more disparate than those of the upstream nodes. This difference can be measured by distance, such as KL divergence, Euclidean distance, chi-square distance, etc. The advantage of this method is that it directly models uplift more accurately. The disadvantage is that the model requires higher cost for reconfiguration.
3.2 Differential Response Model
-
Two Model Approach
Independently model the experimental group and control group of the A/B test to obtain the probability of user behavior. The difference between the expected probabilities of the two models is the uplift score. During prediction, the two models separately predict for the same user, and the difference between the two predicted values represents the causal effect. The advantage of this approach is its simplicity and the ability to leverage existing classification models. However, its major drawback is that it essentially mimics an incremental model using a response model, leading to potential accumulated errors. -
One Model Approach
Merge the experimental and control groups and introduce the Treatment variable as a categorical feature in the user characteristics. This allows building a single model for all samples. The advantage of this approach is that it avoids error accumulation and can utilize existing models. However, the downside is that it is still fundamentally a response model. Moreover, once the training data is merged, it becomes questionable whether X and T still satisfy the conditional independence assumption.
3.3 Model Evaluation
Considering the counterfactual nature of uplift models, we cannot compute accuracy, recall, AUC, or similar metrics using the confusion matrix on a test set. However, under the Conditional Independence Assumption (CIA), assuming all sample features follow the same distribution, we can estimate the uplift score for both the experimental and control groups, sort them in descending order, and segment them into deciles. By calculating the conversion rate difference between the two groups within each decile, we can represent the uplift in that interval. This approach aligns experimental and control group data, enabling indirect evaluation. Plotting a cumulative histogram of uplift can yield a Gini curve or other metrics to assess different uplift models.
3 Sample Code
Python provides the pylift package, which comes with comprehensive official documentation. Below is an example code snippet.
import numpy as np
import pandas as pd
# Simulating dataset
df = {'X1':list(np.random.normal(10,5,100)),
'X2':list(np.random.normal(11,5,100)),
'X3':list(np.random.normal(20,5,100)),
'Treatment':list(np.random.randint(0,2,100)), # Experimental group (1) / Control group (0)
'Converted':list(np.random.randint(0,2,100))} # Randomly generated binary outcome
df = pd.DataFrame(df)
df.head()
# Below is the official example code, using XGBoost by default
from pylift import TransformedOutcome
up = TransformedOutcome(df, col_treatment='Treatment', col_outcome='Converted')
up.randomized_search()
up.fit(**up.rand_search_.best_params_)
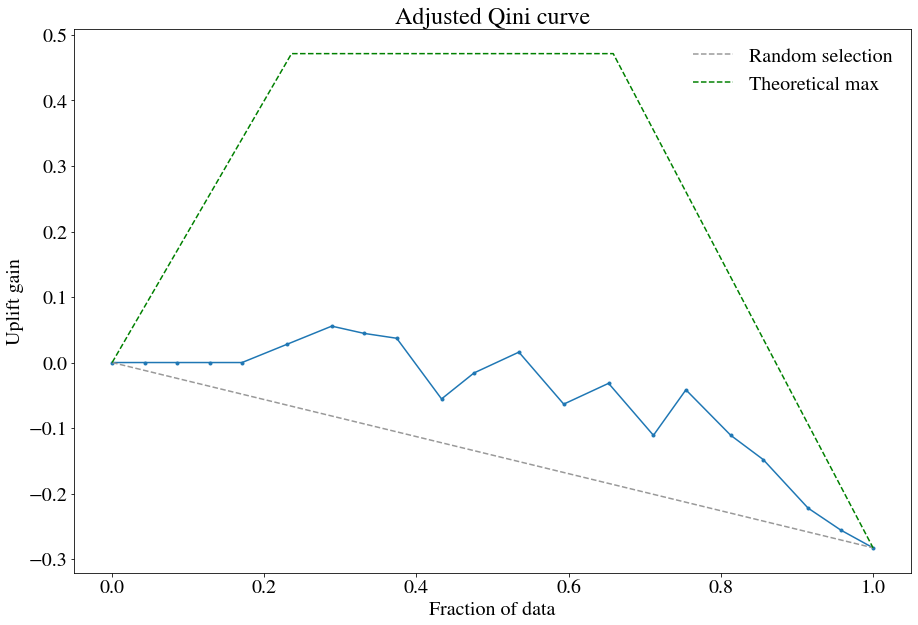
up.plot(plot_type='aqini', show_theoretical_max=True)
print(up.test_results_.Q_aqini)
The output result is shown below. Since my randomly generated dataset is too arbitrary, the graph looks a bit odd. Typically, the slope should be positive, so I recommend trying it with real data.
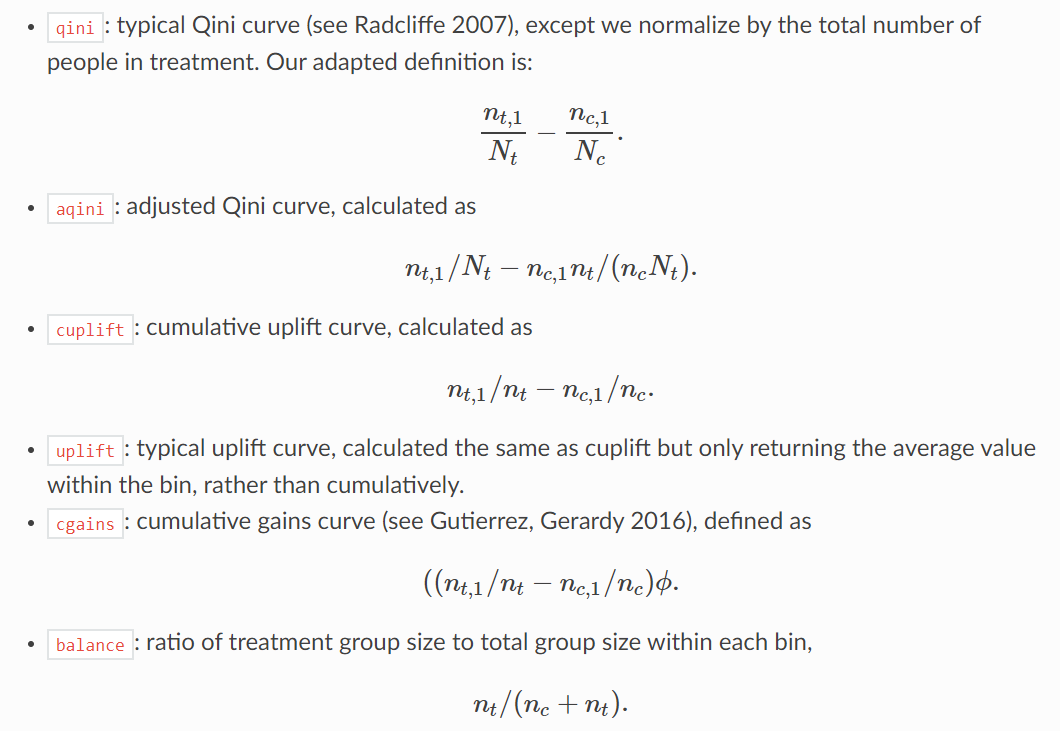
For model evaluation, pylift provides six types of plots, briefly introduced below. Refer to the official documentation for details.
4 Conclusion
Uplift models focus on causal relationships rather than correlations. Therefore, both modeling and evaluation differ slightly from traditional response models. Fundamentally, uplift modeling is about counterfactual causal inference and conditional probability. It is important to note that uplift models rely on the CIA assumption and impose strict data requirements. In practical applications, careful attention must be given to sample selection.
I hope this sharing is helpful to you. Feel free to leave a comment for discussion.