Summary of KDD Cup2021 Time Series Anomaly Detection Competition
1 Introduction
In our previous article on time series anomaly detection, we introduced the KDD Cup2021 time series anomaly detection competition. The competition required us to identify the unique anomaly point in each of the 250 time series. Recently, the competition announced the solution of the top-scoring teams. Today, let's take a look at these high-scoring solutions and learn from them.
2 Background Introduction
The first place went to the team from DeepBlue Technology. The company has some AI robot products and is also keen on participating in various competitions. Their solution is TsaDetect: An efficient and flexible time series anomaly detection framework. Overall, they integrated several time series anomaly detection algorithms and achieved good results.
3 Finding Period
Since the time series provided in this competition are very regular and have clear cycles, the anomalies in each sequence can generally be considered as anomalous cycles. Therefore, the first problem we need to solve is to find the period of the time series. In the competition, we used the Fourier transform to find the period. So, what is the Fourier transform?
Firstly, the Fourier series concept refers to the decomposition of any periodic function into sine functions of different periods (or different frequencies, where the frequency is equal to the reciprocal of the period), and then adds up these sine functions. Therefore, the different frequencies constitute the frequency spectrum of the sequence. The horizontal axis is the frequency, and the vertical axis is the amplitude.
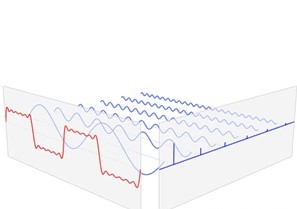
Generally, in the frequency spectrum, the frequency at which the amplitude is the largest is the frequency of the original sequence, because at this frequency, the sine function of this frequency and amplitude includes the peak and valley of the original sequence. We can determine the period of the original sequence in this way.

We can plot the frequency spectrum of the sequence in Python using the following code:
import scipy
import matplotlib.pyplot as plt

X = scipy.fft.fft(this.values.reshape((-1,))) # Fourier transformed values
freqs = scipy.fft.fftfreq(len(this.values),1)
fig=plt.figure(figsize=(20,12))
plt.plot(freqs,np.abs(X))# np.abs is amplitude
Let's use the following sequence provided by the competition to try it out:

Unfortunately, this method did not work well on this sequence.
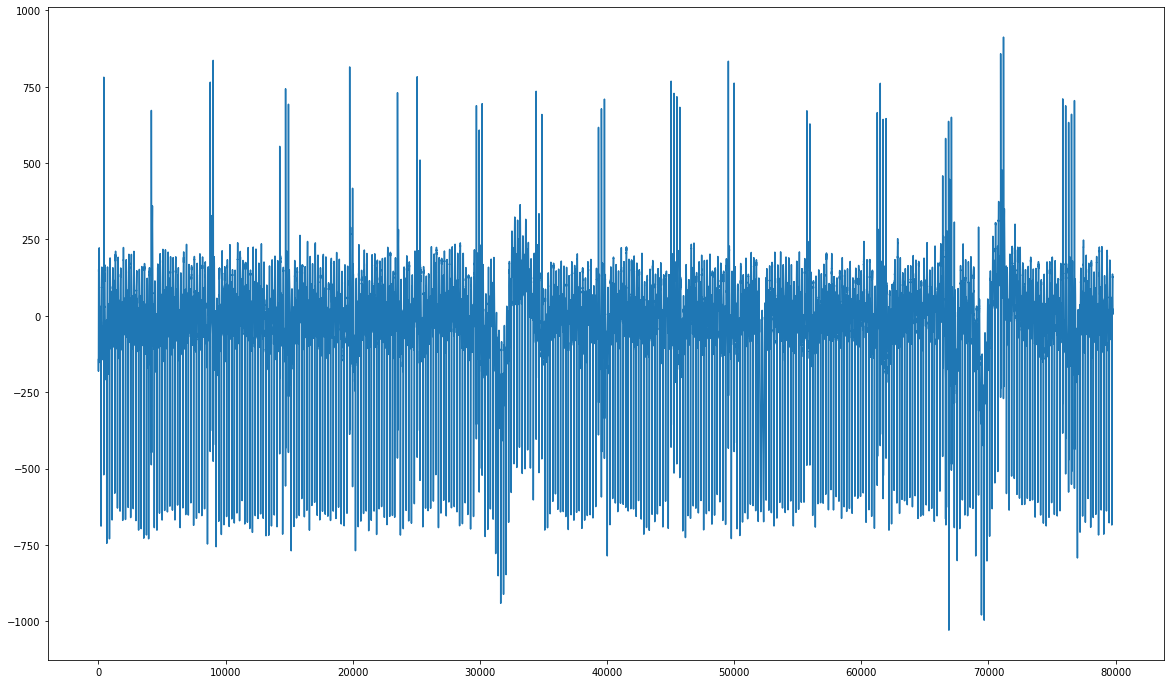
It can be said that using Fourier transform to find the period is a traditional way of finding the period, but it is not suitable for some sequences.
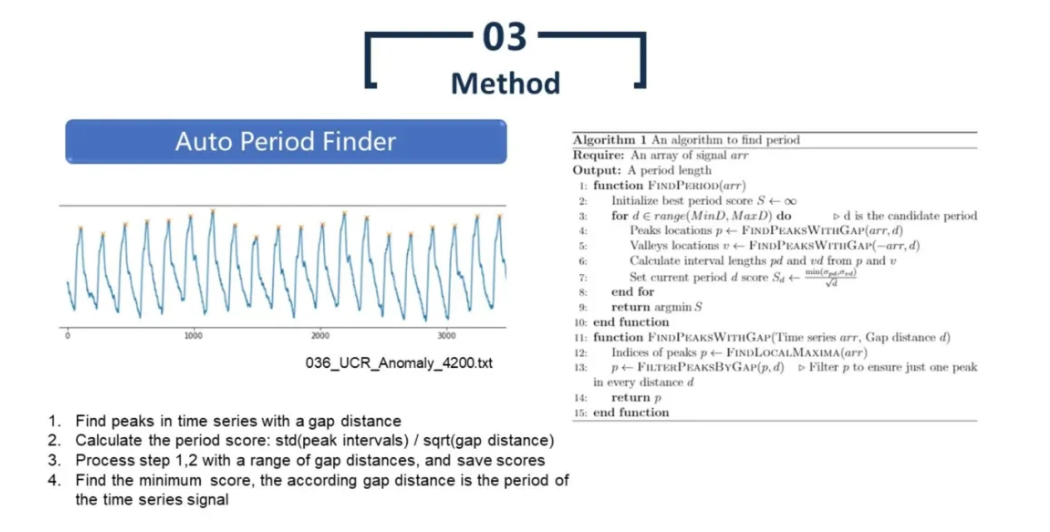
Now, let's take a look at how the high-scoring solution did it. Given a period length (gap distance), find the peak value of each period, then calculate the peak interval between them. The final score equals std (peak intervals) / sqrt (gap distance). By traversing different period lengths, the minimum score can be obtained, and this period length is the period of the sequence. Intuitively, the more stable the distance between peak values is, the longer the period length (preferentially larger scale period), and the more likely this period will be the period of the original sequence. This method also seems to be scientific.
4 Anomaly Detection Algorithm
After finding the period, the next step is to use different time series anomaly detection algorithms. The high-scoring solution mainly used Fourier filtering algorithm, Matrix Profile algorithm, and regression-based algorithms.
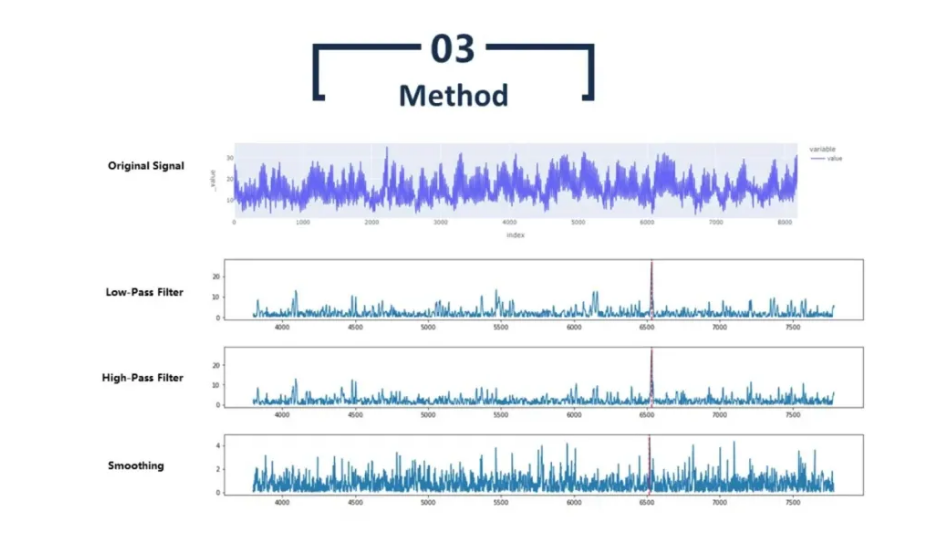
4.1 Fourier Filter Algorithm
The Fourier filter algorithm refers to performing Fourier transform on the original sequence and removing some frequency components in the frequency domain. Then transform the sequence back to the time domain by taking the inverse Fourier transform. Finally, compare the transformed sequence with the original sequence to obtain the residual, and find the anomaly point based on the residual. The high-scoring team used high-pass, low-pass filtering, as well as smoothing, and all of them can successfully locate the anomaly points. It is worth mentioning that the anomaly points of this sequence are actually difficult to identify by the human eye.
4.2 Matrix Profile Algorithm
We have introduced the Matrix Profile algorithm in the previous article. The specific idea is to calculate the Euclidean distance between each interval and other intervals to obtain the anomalous interval.
4.3 Regression-based Algorithms
The regression-based algorithm is to use a model to solve a regression problem to predict the value of a certain point. Then in the test set, calculate the residual between the predicted value and the true value, and find the point with the maximum residual as the anomaly point. The high-scoring solution attempted different algorithms, and ultimately chose GBDT and CNN algorithms. It is worth mentioning that X can take the data on both sides of the predicted value. Moreover, the area around the anomaly point may also be anomalous. To address this issue, there is a gap between X and the predicted value.
5 Model Ensemble
With some good basic models, the high-scoring solution finally used weighted ensemble. In terms of weight setting, they used the confidence of each model. The calculation of the confidence of each model is the maximum residual divided by the second maximum residual. Intuitively, the larger this value, the more confident this model is when identifying the point with the maximum residual as the anomaly point. This applies to the task setting where there is only one anomaly point.
6 Conclusion
It can be seen that the high-scoring solution also uses some more traditional time series anomaly detection algorithms. However, what is worth learning is that the solution pays great attention to the details of each step, whether it is at the beginning to determine the period length or to choose different effective algorithms, or to set weighted weights at the end. The high-scoring team has their own thinking and experience, which is worth learning from.