Time Series Anomaly Detection
Info
Author: Void, Published on 2021-07-20, Reading time: about 10 minutes, WeChat official account article link:
1 Introduction
The reason for this is that a friend told me about the KDD Cup 2021 competition recently. To join in the excitement and gain some experience, we decided to participate (as cannon fodder) together. There are three questions: time series anomaly detection, graph-related questions, and smart cities. The most common time series anomaly detection was therefore our choice.
2 Requirements
The competition requires us to detect outlier points in time series data. Each time series has only one outlier point. The problem provides the interval where the outlier point is located and asks us to identify the position of the outlier point.
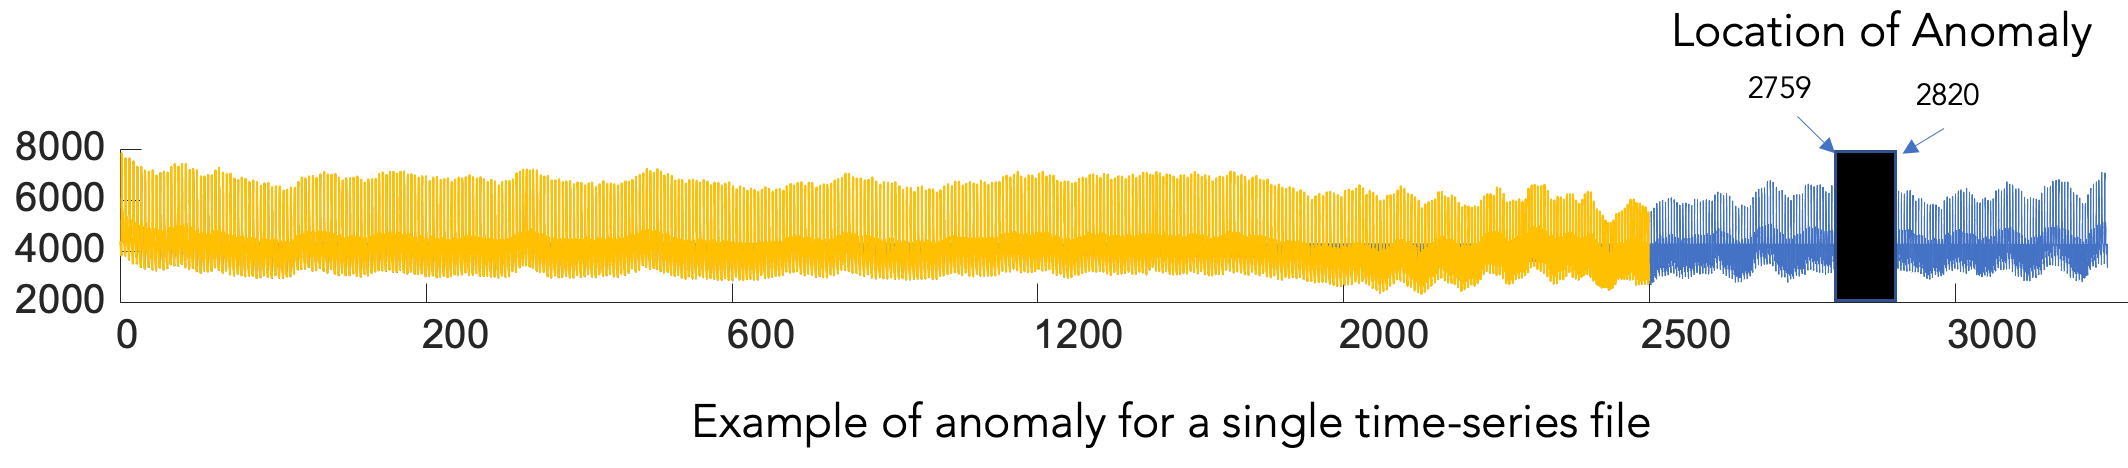
During evaluation, we are required to examine whether the range of 100 points before and after the position we provide contains the true outlier point. The length of the sequence ranges from a few thousand to several hundreds of thousands of observation points. The source of the data may be electrocardiograms, sensor data, and other data with obvious periodicity. The goal is to find effective algorithms to monitor such data on a large scale automatically.
The competition is divided into two phases. Phase I has 25 time series for algorithm debugging. Phase II has 250 sequences for evaluating competition results.
3 Data Analysis
Let’s look at a time series.
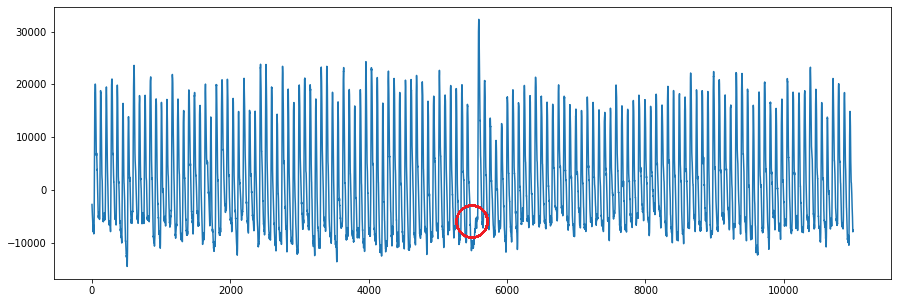
It can be seen that this sequence has a strong periodicity. At the same time, the problem tells us that the anomaly point is located after the 2500th point. Through artificial intelligence (human eye) recognition, we can find that the data around the 5500th point seems to be a bit strange. So, how can we identify it through an algorithm?
4 Initial Attempts
Most people may know that extreme values can be identified by mean+-several times standard deviation. However, this method has several drawbacks: - Can identify a bunch of extreme values, unable to determine which one is the outlier - Extreme values may not be outliers, please see:
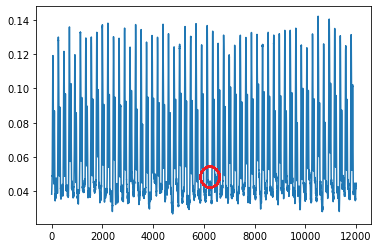
Through human eyes, we can see that the outlier is located near the 6000th observation value. However, there are no extreme values in that area. Therefore, for time series with strong periodicity like this, extreme values may also be part of the periodicity. What we need to identify is a small interval that is different from other periods.
5 Matrixprofile Algorithm
So, how can we identify the interval of outlier on a periodical level? We may think about determining an interval first, and then see if this interval is different from other intervals of the same length. The problem kindly provided us with such a package: matrixprofile.
The matrixprofile algorithm was proposed by researchers at the University of California, Riverside in 2016. The idea is quite clear and simple: given a window size, the distance between this subsequence and other sub-sequences of the same length is calculated, and the distance to the most similar sequence (the one with the minimum distance) is labeled as the mp value of this sub-sequence. By sliding the window, we can calculate the mp value of the entire sequence. Among them, larger mp values can be considered as a greater possibility that this sub-sequence is an outlier because the distance between this subsequence and the most similar sequence is relatively large.
The matrixprofile package has optimized the calculation efficiency, such as standardizing the subsequence in distance calculation, requiring only the calculation of dot products, and avoiding the calculation of Euclidean distance.
6 Trying it Out
The use of matrixprofile is straightforward:
import matrixprofile as mp
profile= mp.compute(data,windows=window_size,n_jobs=8)
discords=mp.discover.discords(profile,k=1)
start_index=discords['discords'][0]
We use the time series we looked at the beginning as an example. Through identification by human eye, we found that the outlier is located near the 5500th observation value. Let's see how to use matrixprofile:
First, we need to determine the window (subsequence) length. We use the Fourier transform to obtain the period (the point with the largest amplitude in the frequency domain). After calculation, matrixprofile tells us that the starting point of the sub-sequence with the maximum mp value is 5500, and the entire sequence of mp values is shown in the figure below:
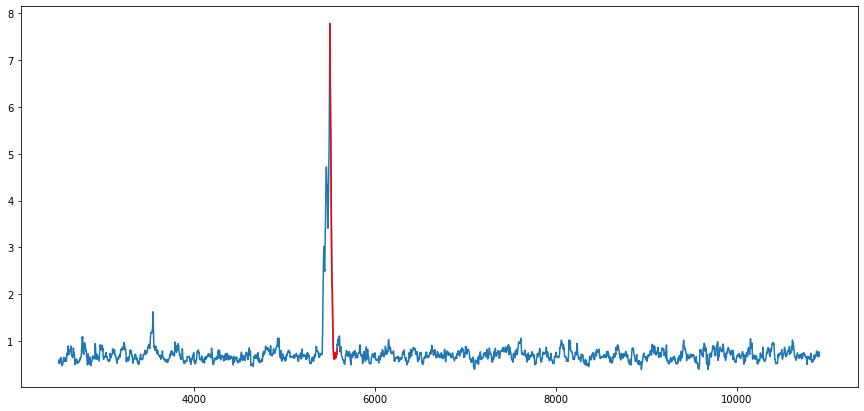
It can be seen that this sub-sequence is clearly different from other sub-sequences in distance. We have successfully found an abnormal sequence that is completely consistent with human eye recognition, and we can simply assume that the outlier point is the midpoint of this sub-sequence. What needs to be done next is to traverse all time series, find the outlier value, and submit it. Through matrixprofile, a simple and straightforward algorithm, we successfully reached the 88th percentile of the leaderboard (the first one is 100%).
7 Conclusion
For time series with strong periodicity like this, the goal of anomaly detection is to find the sub-sequence with significantly greater differences. It can be seen that matrixprofile has achieved good results. Of course, there are more complex and fancy algorithms, such as frequency spectrum-related algorithms, waiting to be explored further.