Efficacy Analysis - Selection of Minimum Sample Size n
Info
Author: Echo, Published on 2021-12-11, Reading Time: Approximately 6 Minutes, WeChat Public Account Article Link:
1 Introduction
When reading Principles of Economics by Mankiw, the most memorable sentence for me is: People face trade-offs, the cost of something is what you give up to get it. In simple terms, everything has a cost, and every choice involves trade-offs. This sentence is particularly suitable in a production environment. When developing new drugs, analyzing strategies for financial institutions, and judging whether a new feature in a system is effective, in all places where hypothesis testing is required, the choice of sample size for the test is important, as the credibility of the test is not high with a small sample size, and the cost is too high if the sample size is too large. In this case, how to choose the minimum sample size that represents the sample and makes the test effective becomes particularly important.
2 Process Introduction
Before we start, let's review the basic concepts of hypothesis testing. Similar to a reductio ad absurdum argument, we usually set the hypothesis we want to reject (such as no difference between the experimental group and the control group) as the null hypothesis (H0), and the hypothesis we want to prove (two-sided: significant difference between the experimental group and the control group; one-sided: the experimental group is significantly better/worse than the control group) as the alternative hypothesis (H1). The purpose of the experiment is to reject the null hypothesis.
The probability of making a Type I error (rejecting a true null hypothesis) is α, also known as the significance level; the probability of making a Type II error (accepting a false null hypothesis) is β. The power of the test is 1-β, which is the probability of correctly rejecting the null hypothesis when it is false.
In addition, the effect size is a measure of the magnitude of the effect and can be used to reflect whether statistically significant differences have practical significance or importance. It is usually the difference or standardized difference of the group mean, the ratio difference of the group mean or ratio (RR, HR), OR, or correlation and regression coefficient. Since the effect size is a posterior concept, and the selection of the minimum sample size is a prior concept, the required effect size can usually be obtained through historical data or expected results of the current experiment.
2.1 Determine the Research Object
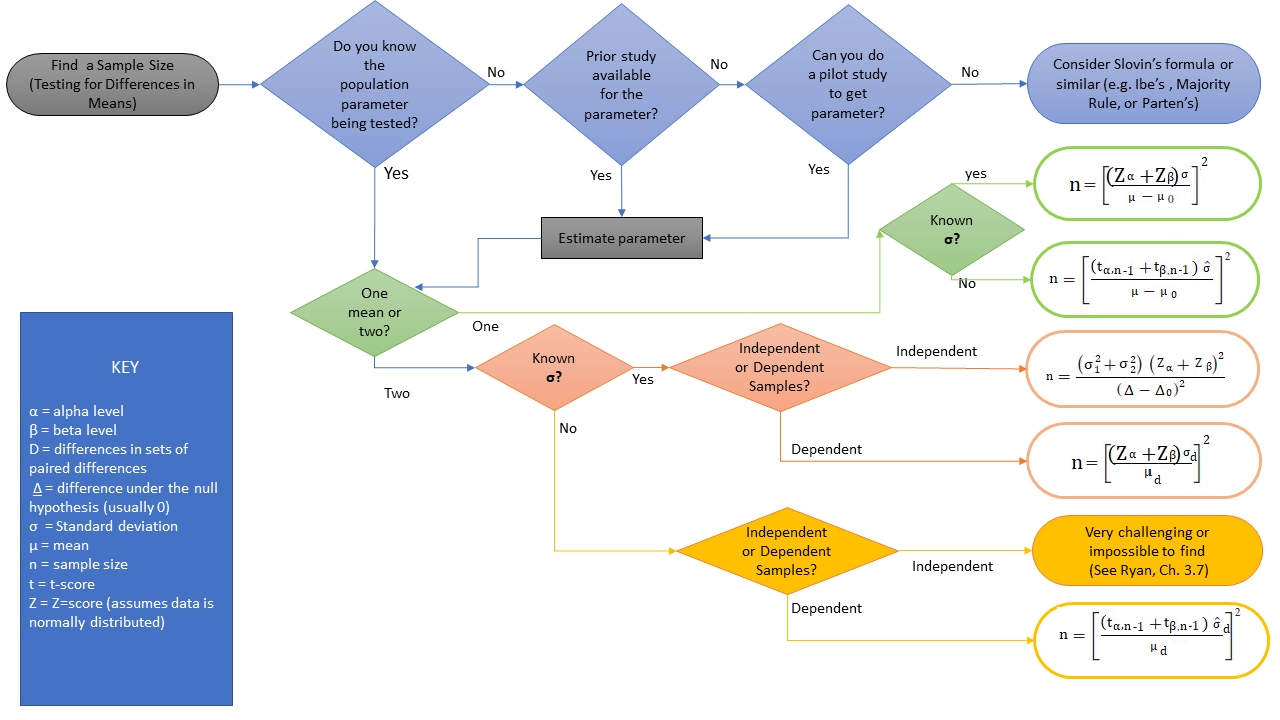
Before considering what test method to use, the first thing to clarify is our research object. The thinking process is as follows:
- Are we comparing means or variances? (affecting the choice of test methods);
- If we are comparing means, are they absolute values (clicks) or ratios (click-through rates)? (affecting how the standard deviation is calculated);
- Are we using random sampling with or without replacement? (affecting how the standard deviation is calculated);
- Are the samples independent or not? (affecting how the standard deviation is calculated);
- Is the variance known or unknown? (affecting the choice of distribution);
- Is it a single-sample or a two-sample test? (affecting how the standard deviation is calculated);
- Is it a one-sided test or a two-sided test? (affecting the choice of α or α/2 when referring to the statistical distribution table);
- And so on.
Considering that the testing of multiple samples can be elaborated on separately in an analysis of variance (ANOVA) article (including F tests and ANOVA), here we focus on hypothesis testing of single/two-sample means/ratios.
2.2 Determine the Test Method
After clarifying the research object, we can choose the appropriate test method. If the object is mean, the Z-test/t-test is commonly used; if it is a ratio, the chi-square test can be considered. Once the test method is determined, we can write out the formula for the test statistic, and reverse the calculation to obtain the formula for the minimum sample size n. There are many formulas for the test statistic, and we will not elaborate on them here. An example of a mean formula is shown in the figure below. Note that if it is a two-sided test, change α to α/2.
2.3 Example of Click-Through Rate Test
AB testing is frequently mentioned in the production environment, for example, when the current user in the app is shown an A-type ad, we want to know if the click-through rate will be better than A if it is changed to a B-type ad. Considering that clicks or no-clicks follow the Bernoulli distribution with a discrete distribution of (0,1), this problem is actually a chi-square test of two samples of proportions, which is equivalent to a two-sample z-test. Assuming that the click-through rate for A-type ad is 30%, we hope that the click-through rate for B-type ad can be increased by 10% to 30%*1.1=33%. When the sample sizes and variances of the two groups are similar, Cohen's d can be used to calculate the standard deviation and measure the effect size. Substituting the minimum sample size n calculation formula into the formula, we get that the n for each group is 1881, and therefore the total sample size is 3762. The calculation is implemented in the code in the next section.
2.4 Implementation of Code
There are many ways to implement the minimum sample size calculation. One commonly used method is the statsmodels package in Python.
from statsmodels.stats.power import GofChisquarePower
from statsmodels.stats.power import zt_ind_solve_power

from statsmodels.stats.proportion import proportion_effectsize as es

#Chi-Square Test
#Set the significance level to 0.05, the test power to 0.8, and the effect size to the standard deviation calculation method. The (expected) rates of the control group and experimental group are 30% and 33% respectively. The number of samples in the experimental group is equal to that in the control group. The test is a two-sided one.
GofChisquarePower().solve_power(effect_size=es(prop1=0.33, prop2=0.30, method= 'normal'), alpha=0.05, power=0.8,n_bins=2)

#Z-Test
#Set the significance level to 0.05, the test power to 0.8, and the effect size to the standard deviation calculation method. The (expected) rates of the control group and experimental group are 30% and 33% respectively. The number of samples in the experimental group is equal to that in the control group. The test is a two-sided one.
zt_ind_solve_power(effect_size=es(prop1=0.33, prop2=0.30, method= 'normal'), alpha=0.05, power=0.8, ratio=1.0, alternative="two-sided")
The results are shown below.
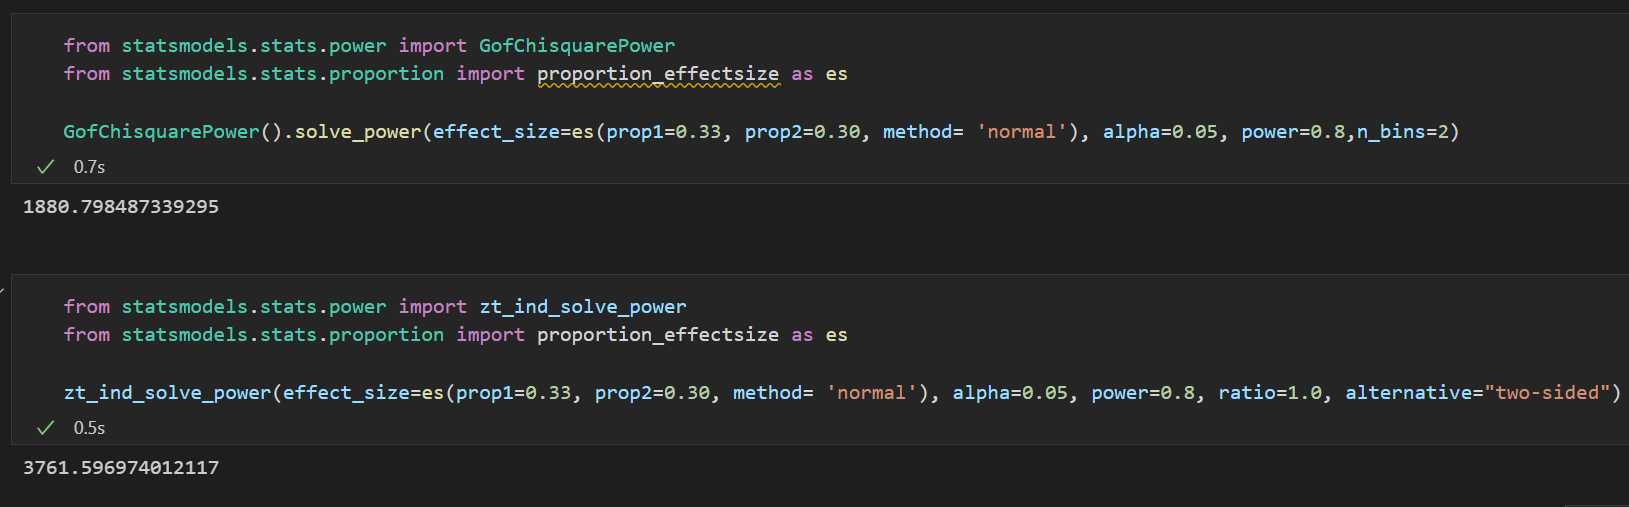
Note that the excess approximation is used here, and the minimum sample size shown in the chi-square test is the sample size per group, while the minimum sample size shown in the z-test is the total sample size of the experiment. The minimum sample size for each group is 1881, and the total sample size is 3762.
In addition: α is commonly set to 0.05, and β is commonly set to 0.2. From this, we can also see people's preferences. People tend to strictly control the probability of rejective truths, even