Useful Python Packages
1 Introduction
A large part of why Python is so popular is that it can easily call packages that implement various functions. For example, Pandas and Numpy are commonly used objects for data science practitioners. In addition to these, based on my actual experience, this article will introduce some obscure and useful Python packages, giving you a boost in using Python.
2 Useful Python Packages
2.1 tqdm
tqdm is a small tool that displays a loop progress bar. Have you ever experienced writing a complex loop, clicking "run" with joy, yet all you see is that the program is running and you will never know how long this loop takes to run? You may not even know if it is running or if the kernel has crashed.
With tqdm, all you need to do is add it to the iterator of the loop, and you can see the progress bar, the time for each loop, and the estimated total time.
for i in tqdm(range(100)):
    sleep(0.01)
It is worth mentioning that tqdm can also be applied to DataFrame apply(groupby).
import numpy as np
import pandas as pd
from tqdm.auto import tqdm
df = pd.DataFrame(np.random.randint(0, 100, (100000, 6)))
tqdm.pandas(desc="my bar!")
df.progress_apply(lambda x: x**2)
2.2 dateutil
When it comes to time format processing, I really like to use the parse method in the dateutil package. It can give a standardized time output based on different formats of time input in a smart way.
from dateutil.parser import parse
In: parse('22nd,July,2009')
Out: datetime.datetime(2009, 7, 22, 0, 0)

In: parse('2018-04-20')
Out: datetime.datetime(2018, 4, 20, 0, 0)

In: parse('20180420')
Out: datetime.datetime(2018,4,20,0,0)
2.3 line_profiler and memory_profiler
line_profiler and memory_profiler are analyzers used to monitor code execution time and memory consumption, respectively. They can display, in a straightforward way, which lines or functions are taking up too much time or memory, thus facilitating code optimization.
Their use is relatively simple, just add a decorator around the code to be examined.
For memory_profiler:
Create example.py.
@profile
def my_func():
    a = [1] * (10 ** 6)
    b = [2] * (2 * 10 ** 7)
    del b
    return a

if __name__ == '__main__':
    my_func()
Then run it in the command line:
python -m memory_profiler example.py
The output is as follows:
Line #    Mem usage    Increment  Occurrences   Line Contents
============================================================
     3   38.816 MiB   38.816 MiB           1   @profile
     4                                         def my_func():
     5   46.492 MiB    7.676 MiB           1       a = [1] * (10 ** 6)
     6  199.117 MiB  152.625 MiB           1       b = [2] * (2 * 10 ** 7)
     7   46.629 MiB -152.488 MiB           1       del b
     8   46.629 MiB    0.000 MiB           1       return a
For line_profiler:
Create a script:
@profile
def slow_function(a, b, c):
    ...
Then run it in the command line:
python -m line_profiler script_to_profile.py.lprof
The output is as follows:
Pystone(1.1) time for 50000 passes = 2.48
This machine benchmarks at 20161.3 pystones/second
Wrote profile results to pystone.py.lprof
Timer unit: 1e-06 s

File: pystone.py
Function: Proc2 at line 149
Total time: 0.606656 s

Line #      Hits         Time  Per Hit   % Time  Line Contents
==============================================================
   149                                           @profile
   150                                           def Proc2(IntParIO):
   151     50000        82003      1.6     13.5      IntLoc = IntParIO + 10
   152     50000        63162      1.3     10.4      while 1:
   153     50000        69065      1.4     11.4          if Char1Glob == 'A':
   154     50000        66354      1.3     10.9              IntLoc = IntLoc - 1
   155     50000        67263      1.3     11.1              IntParIO = IntLoc - IntGlob
   156     50000        65494      1.3     10.8              EnumLoc = Ident1
   157     50000        68001      1.4     11.2          if EnumLoc == Ident1:
   158     50000        63739      1.3     10.5              break
   159     50000        61575      1.2     10.1      return IntParIO
2.4 plotly
There are many Python plot packages, such as matplotlib, seaborn, and plotly. Plotly stands out for its interactivity. You can easily zoom in and out on a specific area or select a curve that interests you. Its use is also very simple:
import plotly.express as px
df = px.data.gapminder().query("country=='Canada'")
fig = px.line(df, x="year", y="lifeExp", title='Life expectancy in Canada')
fig.show()
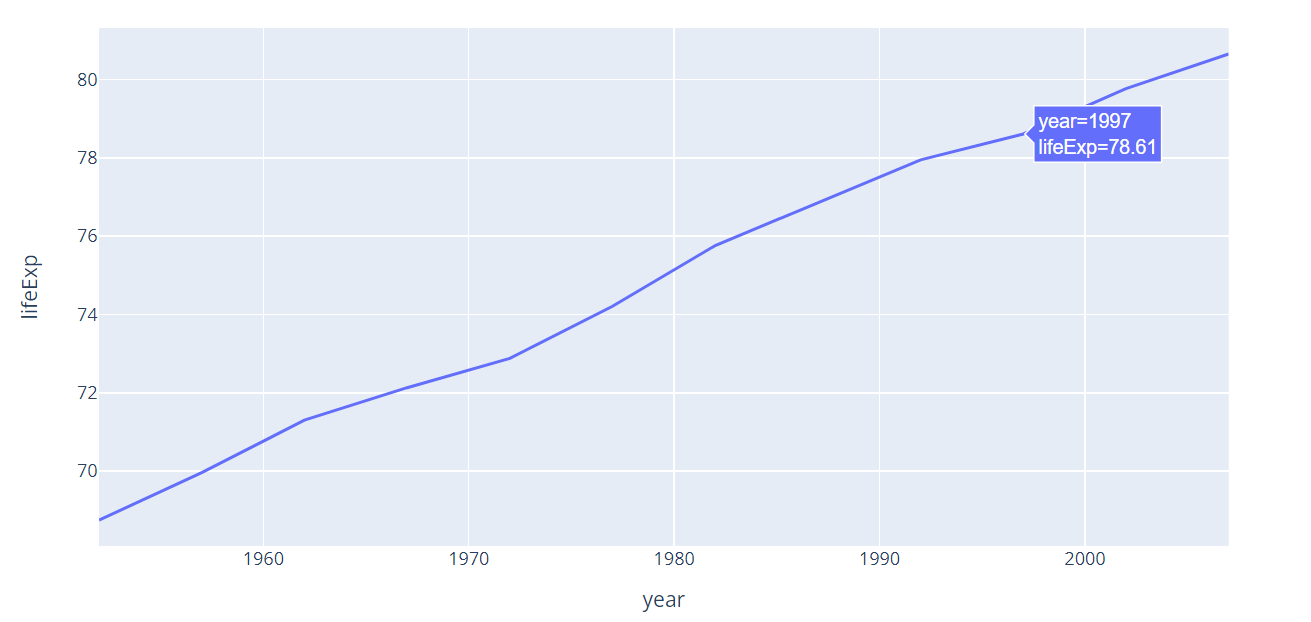
With it, you can analyze data more finely and often gain insights that are not visible in static charts.
2.5 itertools
itertools is a package with low usage frequency but can "rescue you from a fire" in certain situations. It primarily provides various iterative operations, such as cumulative addition, Cartesian product, and connecting multiple lists. Without it, we may need to write a piece of code using loops. With it, we only need one sentence.
# Cumulative addition
>>> import itertools
>>> x = itertools.accumulate(range(10))
>>> print(list(x))
[0, 1, 3, 6, 10, 15, 21, 28, 36, 45]

# All non-repeating combinations
>>> x = itertools.combinations(range(4), 3)
>>> print(list(x))
[(0, 1, 2), (0, 1, 3), (0, 2, 3), (1, 2, 3)]
3 Conclusion
It is because there are so many useful packages and an active